|
|
|
Governor Ned Lamont |
 |
| Home | About Us | Help | Contact | ||
|
LOGIN SELF-SERVICE HRMS FINANCIALS EPM SECURITY TRAINING DAILY MAIL CATALOG OF REPORTS STARS |
|
|
 |
 |
|
|
Catalog of Online Reports
Types of Reports
Purpose
The purpose of this document is to outline the different types of reporting options available within the Core-CT system.
Query Reports (EPM)
Query provides the opportunity to extract the precise information that you’re looking for using visual representations of the Core-CT database. This type of report extracts data from table(s) based on selected records, fields and criteria. Query results present transaction data in no particular format order that can then be viewed on your screen or in MS Excel.
By running a query to MS Excel the user has the ability to sort data, use filters, and create subtotals and pivot tables. Once again the data is "static". Therefore, you must run a new query each time you require updated information. Crystal and nVision reports can be created from these queries.
Core-CT users can write queries that are as simple or as complex as necessary. Queries can be one-time, ad-hoc queries or queries that are run repeatedly. You can use Query in the following ways:
• Display data in a grid (on the Preview tab)
Preview queries within Query Manager and Query Viewer, displaying the result set in a grid for review. This option is useful as you refine your queries.
• Run queries as a separate process
You can run queries as a separate process and have results sent to a separate browser window by selecting the Run option from Query Manager or Query Viewer.
• Schedule a query
You can choose to schedule queries so that they run at predefined times or on recurring schedules. The results of scheduled queries are routed to Report Manager.
• Download query results to an Excel spreadsheet.
Choose to have the data downloaded and formatted as a Microsoft Excel spreadsheet. This option is available in your query search results, or after you Preview or Schedule a query.
EPM data is refreshed daily. Therefore, the information you extract through EPM is only as current as the previous day.
Access to the EPM module is limited to end users that have the EPM Report Maker and EPM Super User roles.
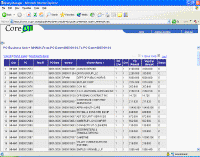
Example of an EPM query output (click to enlarge):
nVision Reports
nVision is a sophisticated tool for creating reports in MS Excel. The user can specify a report layout that defines both the data to retrieve and the format for the report. Once a report has been run, you can then “drill down” to the supporting detail of an amount.
nVision selects data from the Core-CT database using ledgers, trees, and queries. Queries are useful for extracting data from sources other than ledgers. Therefore, the user should be familiar with PeopleSoft Query concepts, especially query result sets, before working with nVision. Also, tree data is used to limit the query results. Therefore, the user should be familiar with nodes and detail values.
nVision works within spreadsheets. You access nVision features from a special nVision menu within Microsoft Excel to create templates (layouts) for data retrieval. Once you create a report layout (XNV file), you can use it to automatically format data.
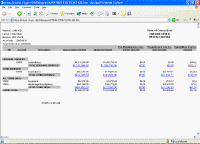
Example of nVision report output (click to enlarge):
Structured Query Reports (SQR)
SQR provides a flexible report writing environment. Reports are generally developed as SQR when procedural logic of a programming language is needed. SQR reports can run to be viewed on your screen or can be run to your printer.
SQR reports are run from a screen on which you need to provide certain selection parameters, such as ledgers, data ranges and chartfields. These reports initially output to a .csv file format which can easily be saved to a MS Excel file format.
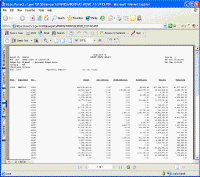
An example of a Structured Query Report output (click to enlarge):
Crystal Reports
Crystal reports provide highly formatted, interactive and professional looking reports. Crystal reports also provide high quality viewing, printing and exporting. Reports can be exported and repurposed to electronic formats used by most end users (e.g. PDF and MS Excel). You may need to provide report parameters such as ledgers, date ranges and chartfields.
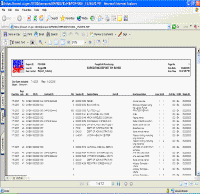
An example of a Crystal Report output (click to enlarge):
|
Home
|
CT.gov Home
|
Send Feedback
|
Login
State of Connecticut Disclaimer, Privacy Policy, and Web Site Accessibility Policy Copyright © 2002-2020 State of Connecticut |

|


